Fleet view: every Claude Code agent on one board
Most days I have several Claude Code sessions open at once, spread over different projects and terminal tabs. One is refactoring, one is writing tests, one finished twenty minutes ago and I haven't looked at it, and one has been stuck on a permission prompt for longer than I'd like to admit.
The notifications in Claudoscope 1.0 cover the moment a session blocks. A banner tells you, and tapping it takes you to the right tab. What they don't answer is the question I kept asking a few minutes later, with five tabs open: what is everything doing right now?
Which agent has been waiting the longest? Which one is still working, and which one died without telling anyone? Which one have I ignored long enough that answering it now means paying to rebuild its cache?
Claudoscope 1.3 answers that with a Fleet view: one board for every Claude Code session that is running now or ran in the last 24 hours, across all projects, sorted so the ones that need you come first.
The question one notification can't answer
A notification is about one session at one moment. When you have one Claude Code session that's all you need. With six, the useful information is relative: this one has waited four minutes, that one twelve, this one is burning money fast and that one is idle with a warm cache.
Before 1.3, Claudoscope had no view of that. The popover's Active Sessions card listed whatever had written to its transcript recently, and that was the whole concept of "active". The dashboard was built around browsing one session at a time, which is fine for reading history and no help when you're trying to decide what to look at next.
What the Fleet board shows
Fleet is a new rail, and it uses the whole window instead of the usual list and detail columns. Across the top, a headline says how many agents need you, with counters next to it for live, working, waiting, and skipped-permission sessions. Below that, the board has four sections.
- Needs you lists waiting agents, oldest first. Each row has a ticking wait timer, the reason ("Finished, ready for review", a permission prompt, a question), and Open and Jump buttons. Command+Return jumps to the oldest one.
- Working shows live agents in the middle of a turn, as cards.
- Parked shows live agents sitting idle: the process is running, but nothing is happening and nobody is asking you for anything.
- Landed is a dimmed list of everything else from the last 24 hours, whether it finished, failed, or was closed.
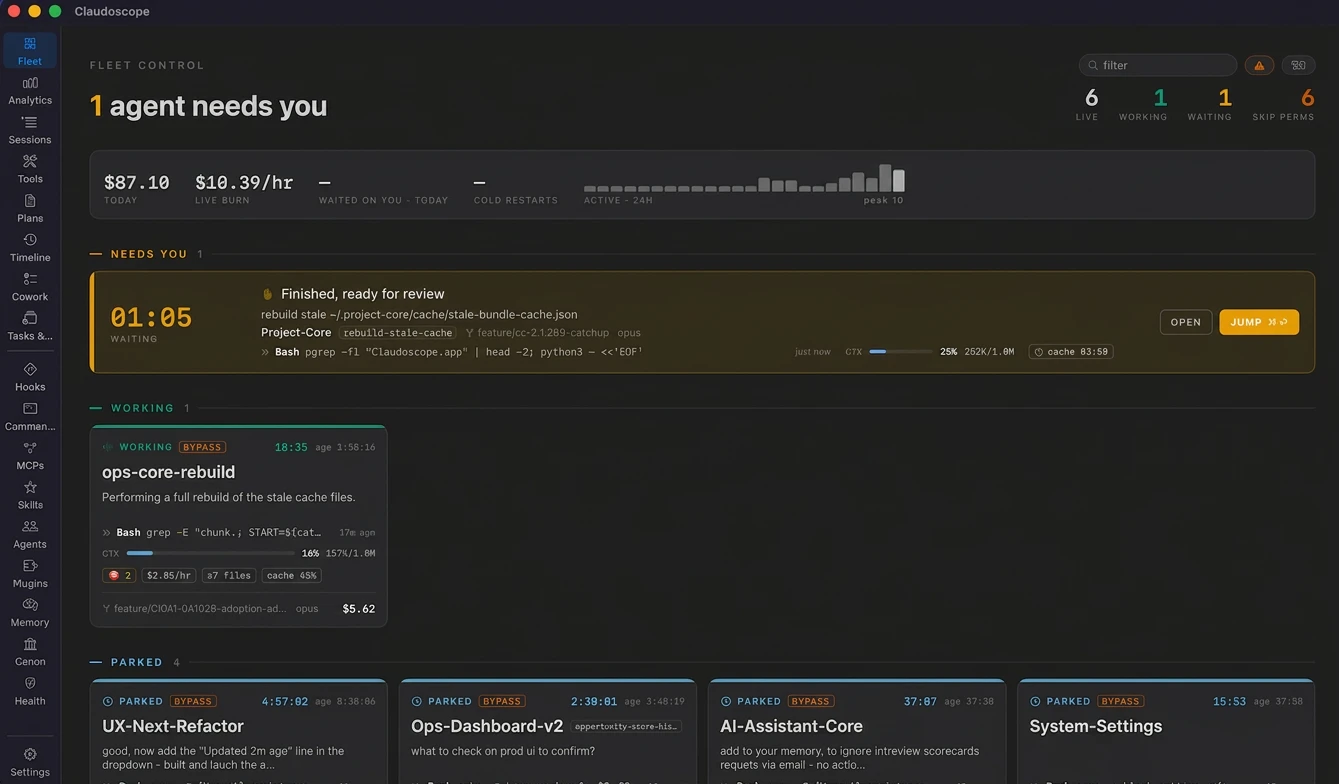
Clicking a card opens an inspector with the agent and process details, plus Focus terminal and Open session buttons. A filter field narrows the board by text, including the session name Claude Code gives a running session (its auto topic name, or whatever you renamed it to). A toggle shows only skipped-permission sessions, and another groups cards and landed rows under project headings. The grouping choice is remembered.
Where a Claude Code session's state comes from
This is the part I spent the most time on, because a board that shows the wrong state is worse than no board.
The old approach was transcript recency. If a session's JSONL file grew in the last few minutes, Claudoscope called it active. That's wrong in both directions. A session running a long tool call can go quiet for a while and look finished, and a session you closed keeps looking active until the window runs out.
It turns out Claude Code keeps a small registry of its running processes, one file per process at ~/.claude/sessions/<pid>.json, with a status field (busy, idle, waiting and so on), the working directory, the session id, and when the status last changed. Claudoscope had never read it. Now liveness comes from the process itself.
The format is undocumented, so Claudoscope treats every field beyond the process id and session id as optional. If Claude Code changes the shape, the cards show less detail instead of the board breaking. The sibling .key files in that directory hold per-process secrets, and Claudoscope never opens them.
State for each card follows a fixed precedence:
- A hook event, if it's newer than the transcript's last activity. The Notification and Stop hooks are the only source that knows why an agent stopped: a permission prompt, a question, or a finished turn.
- Otherwise, Claude Code's registry status for the live process.
- Otherwise, transcript recency, for sessions with no live process.
Every state on the board traces back to a specific record you could open yourself.
The registry also makes crash detection possible. If a process disappears from the registry while Claude Code reported it busy, and no Stop hook arrived, the card lands as Failed with "Process exited mid-turn". Before this, a session that crashed mid-turn just looked done. Resume it and send a prompt, and the failure clears.
Live stats on every card, including the cache clock
Each card is meant to answer "do I need to look at this?" without opening it. It shows:
- How long the agent has been in its current state, and the session's age.
- Your last prompt, as the card's title.
- The last tool call and what it touched.
- A context gauge for the latest turn.
- Average spend per hour, and the cache hit rate.
- Chips for compactions, errors, refused tool calls, and files edited. The refused chip opens Chat with the blocked actions expanded; the files chip opens the Files tab.
The context gauge turns amber and then red based on two things: the share of the context window in use, and the absolute token count. The second one matters with 1M-token windows: 25% of a 1M window is 250K tokens re-sent on every turn, and the percentage alone makes that look harmless.
Spend per hour is a lifetime average, and it's hidden for sessions younger than five minutes, where one expensive first turn would read as an absurd hourly rate. It includes subagent spend, nested subagents too, so a session that delegated heavily doesn't look cheaper on the board than it does in the menu bar. The inspector shows how much came from subagents.
The cache countdown ended up being the stat I look at most. Claude Code's prompt cache expires a fixed time after the turn that wrote it, five minutes or an hour depending on the turn. If you answer a waiting agent after that, the next turn re-writes the whole context to the cache at the cache-write rate. Idle and waiting cards show how long their cache has left, so when two agents are waiting, you can answer the one that's about to go cold first.
Long waits escalate. A wait longer than ten minutes, or one whose cache expires within the next minute, turns the menu bar count, the popover row and the board tile red. That's visual only. I didn't want a second stream of notifications on top of the first.
Fleet telemetry
A strip under the headline shows today's spend by the sessions on the board, the combined spend rate of live agents, and an hourly activity chart for the last 24 hours.
It also shows how long agents waited on you today, mean and longest, and how many of your answers came after the prompt cache had expired, with an estimate of what re-caching that context cost. That one measures me, and it's the number I most wanted to see. Wait history stays on your machine for 30 days.
Getting to the agent that's waiting
The board is useful when the window is open. Most of the time it isn't, so the waiting count also goes to the places you already look.
The menu bar icon shows how many agents are waiting on you, and its dot turns red when a live agent is running with skipped permissions. The popover's Active Sessions card now carries each session's fleet state: waiting and blocked rows come first, with a live wait clock and the reason, and the card tints orange or red when something needs you. Clicking a waiting row brings its terminal tab forward. Clicking any other row opens that session in the dashboard. The card also counts a session as active while its process is alive, not only while its transcript is changing.
There's an optional system-wide shortcut, Control+Option+Command+J, that brings forward the terminal tab of the agent that has waited longest, or opens the Fleet view if nothing is waiting. It's off by default; turn it on under Settings, Fleet. It doesn't need Accessibility permission.
Tapping a "Claude needs you" or "Claude is ready" notification still focuses the terminal, and now also selects that session in the dashboard if the window is open.
Skipped permissions, budgets, and the resume line
A card gets a red Bypass tag while its session runs with --dangerously-skip-permissions, and a faint shield if it bypassed earlier and has since left that mode. This comes from the permission-mode records in the transcript. Plenty of people run some sessions this way on purpose. The risk is losing track of which ones. Cards also show the current permission mode and git branch.
You can set a dollar budget for a session in the inspector. When cost alerts are on, crossing it posts a notification, and so does each doubling after that, even if the general per-session rule is off. Tapping the notification selects the session and focuses its terminal. A budget chip on the card turns amber at 80% and red at 100%.
For sessions whose process has exited, landed rows (on hover) and the inspector copy a ready-to-paste line:
cd <checkout> && claude --resume <id>Claudoscope only copies it. It never runs anything in your terminal.
The Fleet board over MCP
The MCP server from 1.0 gains two read-only tools, list_agents and get_agent. They return the same agents, states and attention order as the board, with wait reasons and times, process details, cost and context, and agents that need you listed first.
In practice that means you can ask Claude Code, in whatever session you're in, which of your other agents are waiting and on what, and get an answer from local data without switching windows.
Also in 1.3
A few things outside Fleet that are worth knowing about:
- Opus 5.5 is priced at its own rate. It was being billed as Opus 5, which overstated its cost by a quarter.
- Claude Code now tags billed turns with the plugin that drove them, and Analytics, Attribution has a new Cost by Plugin table.
- Hooks from plugins that wrap their events in a
hookskey were being read as empty. They now show up in the Hooks rail, the linter, andget_config. - New lint rules, CFG022 through CFG026 and HOOK005, flag settings that recent Claude Code versions skip, ignore, or reserve.
The full list is in the 1.3.0 changelog.
Questions about the Fleet view
- Do I need notifications turned on for the Fleet view to work?
- No. The board works from Claude Code's process registry and your transcripts. The Notification and Stop hooks add the one thing the registry can't tell you, which is why an agent stopped, but Claudoscope only installs them when Notifications are enabled. Without them, states come from the registry and transcript recency, and the Fleet view tells you the hooks are missing and links to the setting.
- Does the jump shortcut need Accessibility permission?
- No. Control+Option+Command+J is off by default and is enabled under Settings, Fleet. It brings forward the terminal tab of the agent that has waited longest, or opens the Fleet view when nothing is waiting.
- How does Claudoscope know an agent crashed?
- If a process disappears from Claude Code's registry at
~/.claude/sessions/while it was reported busy, and no Stop hook arrived, its card lands as Failed with "Process exited mid-turn". Resuming the session and sending a prompt clears it. - Why is my first launch after upgrading to 1.3 slow?
- 1.3 needs a one-time full reparse of your transcripts on first launch. After that, launches load from the cache as before.
Install
Free, MIT licensed, macOS 14 or later, Apple Silicon. Zero telemetry, and it never sends your session data anywhere, because it never sends anything anywhere.
brew tap cordwainersmith/claudoscope
brew install --cask claudoscope
Already installed? brew upgrade --cask claudoscope. Or take the DMG from the 1.3.0 release.